Discrimination, calibration, utility, and uncertainty
Ranking well is not the same as being useful
AUROC is a discrimination measure. It summarises how well a score ranks cases with different observed outcomes under the comparison represented by the data. That question matters, but it is not the whole performance claim. A model can rank cases in a useful order while its probabilities are systematically too high or too low, while no available action improves, or while the ranking changes under a relevant shift in patients or acquisition.
Three questions must therefore be kept separate. Calibration asks whether predicted risks correspond to observed event frequencies for the population and time horizon represented by the evaluation. Decision utility asks whether a specified policy using the predictions improves decisions relative to relevant alternatives, over a threshold or cost range that has meaning in the intended setting. Uncertainty asks how much the estimated performance, calibration, or an individual prediction could vary under the stated sources of uncertainty. None of these questions is answered by AUROC alone.
The distinction also protects the direction of interpretation. A score may be a ranking, a probability, a hazard-related quantity, or a thresholded action signal. A threshold has meaning only after the score scale, event definition, prediction horizon, and consequences of errors have been declared. The same numeric threshold cannot be assumed to carry the same decision meaning after a change in prevalence or clinical context.
Calibration made concrete
Imagine two models with the same ranking and therefore the same discrimination summary. One model’s group predicted at 20% has an observed event frequency near 20%; the other assigns 20% to a group in which the observed frequency is closer to 40%. Their ranking can be identical while their probability scales have different meanings. Calibration plots, calibration-in-the-large or slope summaries where appropriate, and proper scoring measures can expose aspects of that difference. Their interpretation still depends on sample size, grouping, time horizon, and the evaluation population.
The existing synthetic illustration makes the point without using patient data:
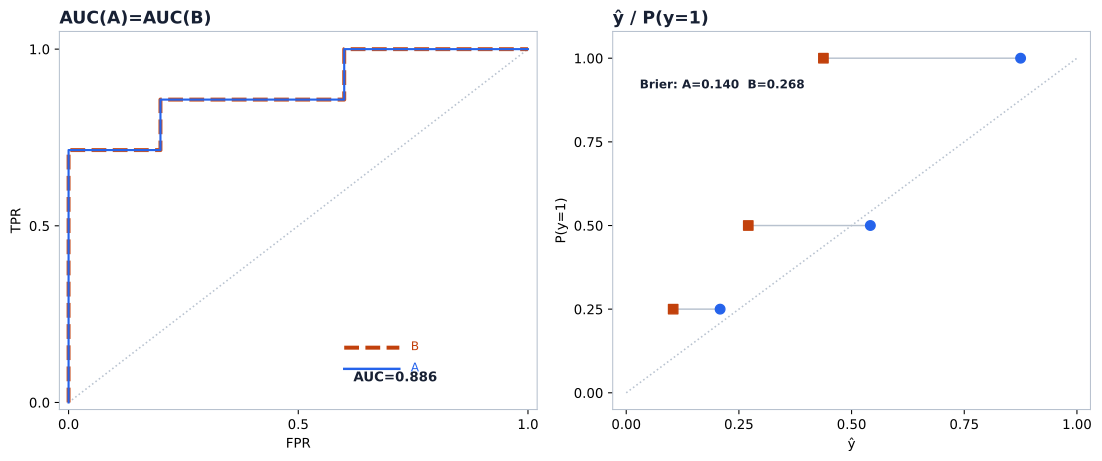
The values and twelve-patient construction belong to the synthetic illustration, not to a clinical cohort. Identical ranking does not imply identical probability meaning.
Decision analysis adds a policy
A prediction becomes part of a decision only through a policy. Decision-curve or net-benefit analyses are one way to compare a model-guided policy with alternatives such as treating everyone or treating no one over a declared range of threshold probabilities. The range is not a decorative axis: it encodes a trade-off between false positives and false negatives for a particular use.
A model can therefore have high discrimination and little or no net benefit over the relevant range. It may rank cases well but not improve the action available to the clinician. Conversely, a modest ranking model can be useful in a narrow decision setting if its calibrated output changes an action in a way that matters. The conclusion must name the policy, comparator, threshold range, event horizon, and population rather than calling the model clinically useful in the abstract.
Utility is not a replacement for calibration. A decision analysis can be misleading if the score, threshold, or event definition is not appropriate to the setting. Nor is utility a replacement for transportability: a policy that helps in one source population may not retain its net benefit after prevalence, workflow, or measurement conditions change.
Uncertainty needs the right object
An interval around an aggregate statistic describes uncertainty in that statistic under a declared sampling or resampling procedure. An AUROC, C-index, Brier-score, or calibration-summary interval quantifies uncertainty in the estimated population-level performance object under that procedure. It does not become an interval for one person’s outcome or risk.
Uncertainty in a fitted calibration intercept, slope, or curve concerns the estimated relationship between predictions and observed frequencies in a stated population and at a stated horizon. It is distinct from discrimination uncertainty and from uncertainty in one person’s risk.
For a specified covariate profile, refitting or bootstrapping can expose variation in the model-estimated risk caused by sampling and fitting. Measurement error and dataset shift add other sources of variation. Such an interval concerns an estimated risk under a model and data-generating assumptions; it is not an observation of that person’s latent true probability.
A prediction interval or set for a future outcome is a different object. Conformal prediction can produce future-outcome sets or intervals with stated marginal coverage under exchangeability. For a binary outcome, the result is a prediction set rather than a conventional continuous-outcome interval. Marginal coverage is not an individual conditional guarantee and does not calibrate the person’s latent risk.
When reading a performance report, ask which object the uncertainty statement belongs to: the aggregate metric, the fitted calibration relation, the estimated risk for a specified individual profile, a future-outcome prediction set or interval, or the decision policy. Also ask whether the relevant source of variation is sampling, model fitting, measurement, domain shift, missingness, or a combination. No single interval can silently answer all of those questions.
The same discipline applies to threshold selection. A threshold chosen after looking at the test outcomes is part of the fitted or selected procedure. If it is re-estimated in a new setting, the resulting sensitivity, specificity, or utility belongs to a changed policy and must not be reported as performance of the untouched model without saying so.
Discrimination, calibration, utility, and uncertainty thus form a set of linked but non-interchangeable questions. The next section asks what kind of test setting is represented, and how far the model has actually travelled before a generalisation claim is made.
Sources
- Collins GS, Moons KGM, Dhiman P, et al. TRIPOD+AI statement. BMJ. 2024;385:e078378. doi:10.1136/bmj-2023-078378.
- Kocak B, et al. CLEAR radiomics reporting checklist. Insights into Imaging. 2023;14:75. doi:10.1186/s13244-023-01415-8.
- Van Calster B, et al. Calibration: the Achilles heel of predictive analytics. BMC Medicine. 2019;17:230. doi:10.1186/s12916-019-1466-7.
- Vickers AJ, Elkin EB. Decision Curve Analysis. Medical Decision Making. 2006;26:565-574. doi:10.1177/0272989X06295361.
- Collins GS, et al. Evaluation of clinical prediction models (part 2): how to undertake an external validation study. BMJ. 2024;384:e074820. PMC10788734.
- Riley RD, et al. Uncertainty of risk estimates from clinical prediction models: rationale, challenges, and approaches. BMJ. 2025;388:e080749. doi:10.1136/bmj-2024-080749; PMC12128882.
- Angelopoulos AN, Bates S. A Gentle Introduction to Conformal Prediction and Distribution-Free Uncertainty Quantification. Foundations and Trends in Machine Learning. 2023;16:494-591. arXiv:2107.07511.
© 2026 Adrian Tkacz · BioMedical-IT
Original text and figures are licensed under the Creative Commons Attribution-NonCommercial 4.0 International License (CC BY-NC 4.0), unless otherwise noted. Please credit Adrian Tkacz / BioMedical-IT and link to the original source. Third-party materials retain their respective rights and licenses.