Diffusion and ADC as model-based measurements
Diffusion weighting changes the signal
Water molecules move over microscopic distances even when the anatomy is still. A diffusion-weighted acquisition applies gradients that make the measured signal sensitive to that motion. Under a given gradient waveform, larger displacements generally create more phase dispersion and more signal attenuation. Restricted motion can reduce that attenuation relative to freely moving water, but the image remains a mixture of diffusion and other effects such as T2 contrast, noise, motion, and distortion.
The strength of the diffusion sensitisation is summarised by the b-value, expressed
in s/mm². A value near zero is approximately a reference acquisition with little
diffusion weighting; increasing the b-value generally increases sensitivity to diffusion
while reducing the remaining signal. A single diffusion-weighted image is therefore
still a relative intensity image. It is not an ADC measurement by itself.
ADC is a fitted map, not a raw intensity
In the simplest monoexponential model, signal at b-value b is represented as
S(b) = S0 · exp(−b · ADC)Here S0 is the model’s reference signal and ADC is the apparent diffusion coefficient.
With a reference and at least one non-zero b-value, the two-point estimate is
ADC = −ln(S(b)/S0) / bWith more b-values, the acquisition can be fitted using a stated model rather than
treating one pair of noisy samples as exact. The resulting map has units of mm²/s,
which makes it more directly quantitative than the arbitrary intensity of a routine
weighted image. It is still an apparent coefficient: it summarises signal behaviour
within a voxel under a particular encoding and model, rather than revealing a unique
microscopic constant for every compartment in that voxel.
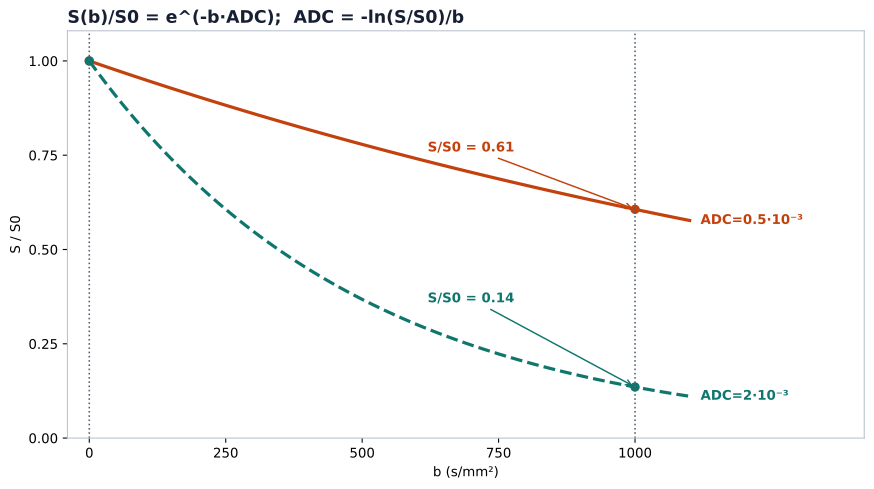
Curves are noiseless schematics, not measured data: clinical ADC depends on the b-values and fit model chosen, tissue state and acquisition quality, and DWI brightness must always be read together with the ADC map. No threshold is implied.
Why the number remains conditional
ADC is often more comparable across scans than raw T1- or T2-weighted intensity, but comparability is not the same as invariance. The fitted value can change with the selected b-values, model, noise, motion, geometric distortion, and the mixture of microenvironments represented by a voxel. Diffusion-weighted echo-planar acquisitions can also make registration and voxel-wise comparison more difficult when distortion is not controlled.
The clinical associations are useful but not one-to-one. Low ADC can accompany restricted diffusion in some hypercellular lesions or acute ischaemic tissue; relatively high ADC can accompany more freely diffusing fluid. These associations do not identify a diagnosis without anatomy, sequence context, and other evidence. A bright DWI region can also reflect high underlying T2 signal, known as T2 shine-through. Reading DWI next to the ADC map helps distinguish signal that persists under diffusion weighting from signal that is simply inherited from another contrast source.
The honest working description is therefore “quantitative-ish”: ADC has a physical unit and is derived from a model, but it inherits acquisition and fitting choices. Record the b-values, model, distortion and motion handling, and do not treat a small ADC difference as self-interpreting. The same signal, once encoded spatially, still has to be sampled and reconstructed. That leads to k-space and reconstruction.
Sources
- Stanford Medicine Body MRI Research Group, MRI Physics Education Materials — public visual orientation on diffusion contrast and MRI signal formation.
- Palombo M, Bodini B, Grussu F, et al. ESR Essentials: diffusion-weighted MRI-practice recommendations by the European Society for Magnetic Resonance in Medicine and Biology. Eur Radiol. 2026;36:2198-2208. doi:10.1007/s00330-025-12033-x. (Full text)
- Boss MA, Malyarenko D, Partridge S, et al. The QIBA Profile for Diffusion-Weighted MRI: Apparent Diffusion Coefficient as a Quantitative Imaging Biomarker. Radiology. 2024;313:e233055. doi:10.1148/radiol.233055. (Full text)
© 2026 Adrian Tkacz · BioMedical-IT
Original text and figures are licensed under the Creative Commons Attribution-NonCommercial 4.0 International License (CC BY-NC 4.0), unless otherwise noted. Please credit Adrian Tkacz / BioMedical-IT and link to the original source. Third-party materials retain their respective rights and licenses.